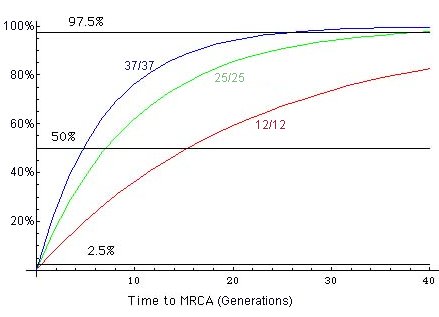
This is a curve that establishes the relationship between the 50% line and the number of markers. As you can easily observe the TMRCA drops very slowly after achieving the 20 marker threshold.
A more detailed explanation and analysis for estimating the Time to the MRCA for the Y chromosome for a pair of individuals can be seen at this page prepared by Dr. Bruce Walsh, our population geneticist and member of our Scientific Advisory Board.
Dr. Walsh has prepared a much more comprehensive analysis -- for people with a statistics background -- and who love to really get into all the details.
Family Tree DNA - Genealogy by Genetics, Ltd. World Headquarters 1919 North Loop West, Suite 110 Houston, Texas 77008, USA
Phone: (713) 868-1438 | Fax: (832) 201-7147
Contact Us All Contents Copyright 2001-2003 Genealogy by Genetics, Ltd.